Node.js ships with an out-of-process debugging utility, accessible via a TCP-based protocol and built-in debugging client. You can start the same using the following command:
$ node debug debugger.js
Read More: “How to Debug Node.js Applications”
This basic debugging is not a fully featured debugging agent. You will be missing the fancy user interface; however, simple inspections are possible.
You can add the debugger statement into your codebase to add breakpoints into your code.
const express = require('express')
const app = express()

app.get('/', (req, res) => {
  debugger
  res.send('ok')
})
This way the execution of your script will be paused at that line, then you can start using the commands exposed by the debugging agent:
- cont or c – continue execution,
- next or n – step next,
- step or s – step in,
- out or o – step out,
- repl – to evaluate script’s context.
V8 Inspector Integration for Node.js
The V8 inspector integration allows attaching Chrome DevTools to Node.js instances for debugging by using the Chrome Debugging Protocol.
V8 Inspector can be enabled by passing the --inspect flag when starting a Node.js application:
$ node --inspect debugger.js
Most of the times it makes sense to stop the execution of the application at the very first line of your codebase and from there on continue the execution. This way you won’t miss any command execution.
$ node --inspect-brk debugger.js
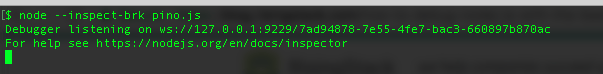
The above command will start the debugger. After this command, open the following url in Google Chrome:
chrome://inspect
This will show the list of the program to inspect.
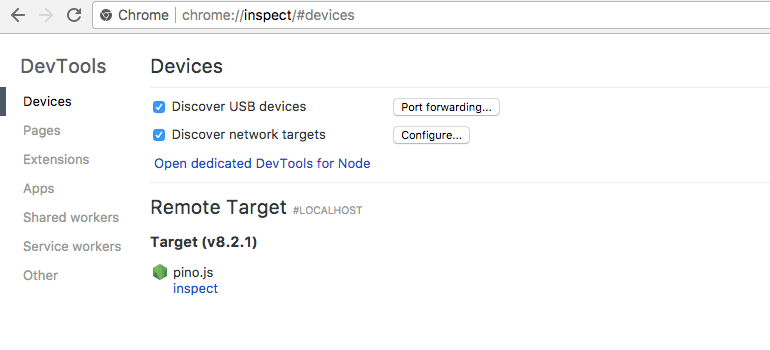
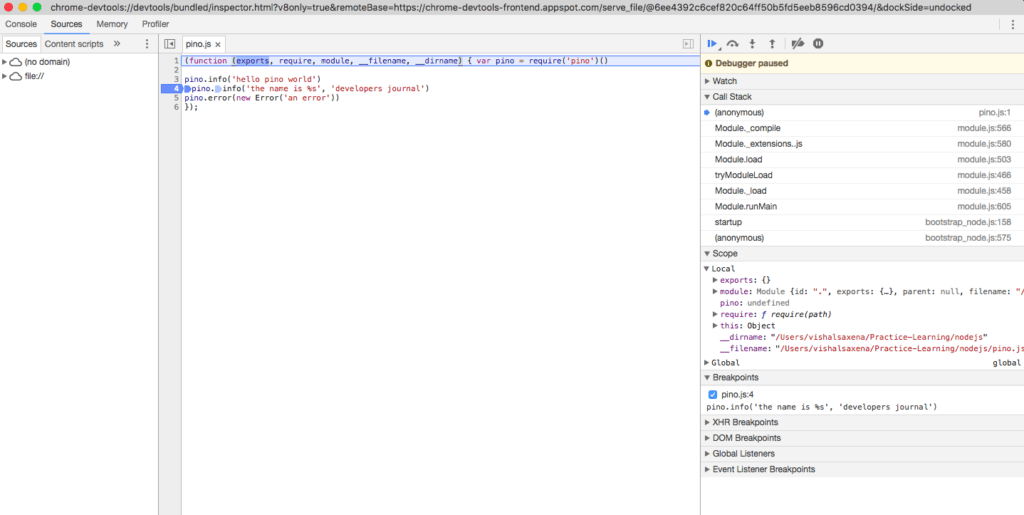
Upon clicking the “inspect” link it will show the debugger window.