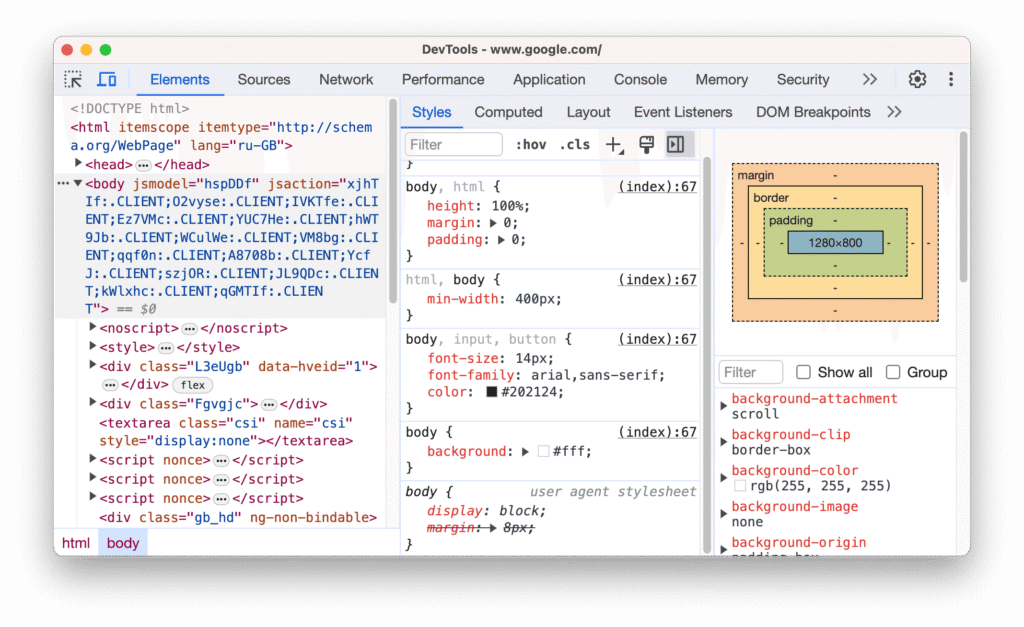
As a developer, you’re likely familiar with the basic Chrome DevTools features like the Console and Network tabs. But did you know that Chrome DevTools contains a treasure trove of hidden features that can dramatically boost your productivity and debugging efficiency? These lesser-known Chrome DevTools capabilities are game-changers that most developers overlook, yet they can save hours of development time and make complex debugging tasks effortless.
In this comprehensive guide, we’ll explore seven powerful hidden features in Chrome DevTools that will revolutionize your development workflow and help you debug like a pro.

Command Palette – Your DevTools Swiss Army Knife
The Command Palette is arguably the most underutilized hidden feature in Chrome DevTools. This powerful tool gives you instant access to virtually any DevTools function without navigating through menus.
How to access:
- Press
Ctrl + Shift + P(Windows/Linux) orCmd + Shift + P(Mac) - Or click the three dots menu → “Run command”
Power commands to try:
Screenshot– Capture full page, node, or area screenshotsCoverage– Find unused CSS and JavaScriptRendering– Access paint flashing, layout shift regionsAnimations– Debug complex CSS animationsSecurity– Check HTTPS and security issuesSensors– Simulate device orientation and geolocation
This single hidden feature eliminates the need to remember where specific tools are located and makes you significantly faster at accessing advanced functionality.
Live Expressions – Monitor Variables in Real-Time
Instead of repeatedly typing console.log() statements, Live Expressions let you monitor JavaScript expressions continuously as your code runs.
How to use:
- Open the Console tab
- Click the “👁️” (eye) icon next to the filter bar
- Enter any JavaScript expression
- Watch it update in real-time
Practical examples:
document.activeElement– Track which element has focusperformance.now()– Monitor execution timenavigator.onLine– Check network connectivity statuswindow.innerWidth + 'x' + window.innerHeight– Track viewport dimensions
This hidden feature is perfect for debugging dynamic applications where values change frequently without cluttering your console output.
Break on DOM Modifications – Catch Elusive DOM Changes
When elements mysteriously disappear or change, DOM breakpoints can catch the exact moment and code responsible for modifications.
How to set up:
- Right-click any element in the Elements panel
- Select “Break on…”
- Choose from:
- Subtree modifications – When child elements change
- Attribute modifications – When element attributes change
- Node removal – When the element is deleted
Pro tip: This hidden feature is invaluable for debugging third-party libraries, dynamic content, or complex JavaScript frameworks where DOM changes happen unpredictably.
When a breakpoint triggers, DevTools automatically switches to the Sources tab and highlights the exact line of code making the modification.
Coverage Panel – Eliminate Dead Code
The Coverage panel reveals how much of your CSS and JavaScript is actually being used, helping you identify and remove dead code for better performance.
How to access:
- Open Command Palette (
Ctrl + Shift + P) - Type “Coverage” and select “Show Coverage”
- Click the record button and interact with your page
- Review the results with color-coded bars:
- Red bars = Unused code
- Green bars = Used code
What you can do:
- Find unused CSS classes and remove them
- Identify JavaScript functions that never execute
- Optimize bundle sizes by removing dead code
- Prioritize critical CSS for faster loading
This hidden feature can reduce your bundle sizes by 20-50% in many cases, directly improving page load performance.
Local Overrides – Test Changes Without Deployment
Local Overrides let you modify any website’s files locally and persist those changes across page reloads, perfect for testing fixes before deployment.
Setup process:
- Open Sources tab
- Go to “Overrides” in the left sidebar
- Click “Select folder for overrides”
- Choose a local directory and allow access
- Make changes to any file in DevTools
- Changes automatically save and persist
Use cases:
- Test CSS fixes on production sites
- Debug third-party library issues
- Prototype new features on existing sites
- Test different JavaScript implementations
- Override problematic external resources
This hidden feature eliminates the need for local development environments when testing small changes or debugging production issues.
Sensors Panel – Simulate Mobile Conditions
The Sensors panel lets you simulate various mobile device conditions without having an actual device.
How to enable:
- Command Palette → “Show Sensors”
- Or Settings (F1) → More tools → Sensors
Simulation options:
- Geolocation – Test location-based features with custom coordinates
- Orientation – Simulate device rotation and tilt
- Idle state – Test idle detection API
- Touch – Force touch events instead of mouse events
Advanced scenarios:
- Test Progressive Web App behavior
- Debug geolocation features with specific coordinates
- Simulate offline conditions
- Test accelerometer-based interactions
This hidden feature is essential for mobile-first development and ensures your applications work correctly across different device capabilities.
Rendering Panel – Optimize Visual Performance
The Rendering panel provides advanced tools to identify and fix visual performance issues that aren’t obvious during normal development.
How to access: Command Palette → “Show Rendering”
Key tools:
- Paint flashing – Highlights areas being repainted in green
- Layout shift regions – Shows areas causing cumulative layout shift
- Core Web Vitals – Real-time CLS, LCP, and FID metrics
- Frame rendering stats – FPS counter and GPU usage
- Scrolling performance – Identifies scroll-blocking elements
Performance debugging workflow:
- Enable paint flashing to see excessive repainting
- Use layout shift regions to identify CLS issues
- Monitor frame rendering stats during animations
- Check for scroll-blocking elements affecting user experience
This hidden feature is crucial for achieving excellent Core Web Vitals scores and providing smooth user experiences.
Bonus Tips for Maximum Efficiency
Quick Access Shortcuts
Ctrl + Shift + C– Inspect element modeCtrl + Shift + J– Jump to ConsoleCtrl + ]/Ctrl + [– Switch between panelsF1– DevTools settings and more tools
Pro Developer Workflow
- Start with Command Palette for quick tool access
- Use Live Expressions for continuous monitoring
- Set DOM breakpoints for mysterious changes
- Run Coverage analysis before optimizing
- Test fixes with Local Overrides
- Validate mobile behavior with Sensors
- Optimize performance with Rendering tools
Conclusion
These seven hidden features in Chrome DevTools represent just a fraction of the advanced capabilities available to developers. The people who make DevTools part of their daily workflow (not just for emergencies) are the ones who outspeed, out-innovate, and out-earn everyone else.
By incorporating these Chrome DevTools hidden features into your development routine, you’ll debug more efficiently, optimize performance more effectively, and ship higher-quality applications. Each of these tools addresses common development challenges and can save you hours of manual testing and debugging.
Start with the Command Palette to familiarize yourself with available tools, then gradually incorporate the other features based on your specific development needs. Remember, mastering these features can streamline your workflow, enhance your debugging skills, and deliver a better user experience.


